
BNB Price Analysis: Binance Coin Holds Key Support as Market Awaits Breakout
Analysisby Hardik Z.


Get the latest crypto insights delivered to your inbox. No spam, unsubscribe anytime.
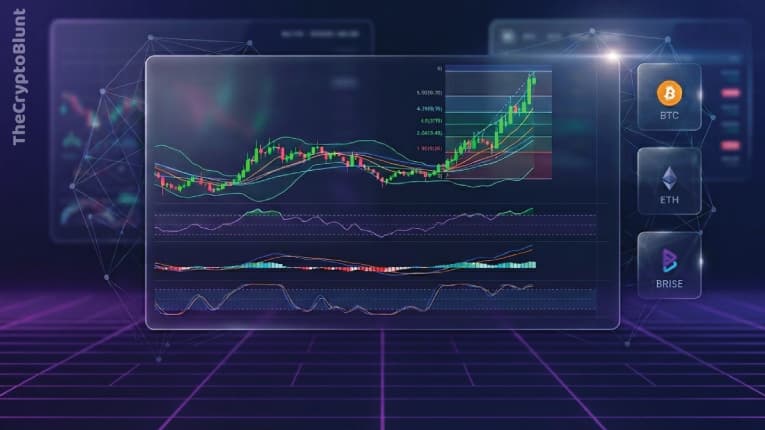
Binance Coin (BNB) is currently trading at a critical technical juncture, with price action showing resilience above a key support zone while gradually building bullish momentum. Recent chart structure highlights a recovery from a short-term dip followed by a steady uptrend, suggesting that BNB may be preparing for its next major breakout. Market Structure: Recovery […]
zkSync Era is a leading Layer 2 (L2) scaling solution for Ethereum that leverages cutting-edge Zero-Knowledge (ZK) Rollup technology. It aims to provide a high-throughput, low-cost, and secure environment for dApps, making Web3 accessible to millions, if not billions, of users. Unlike some other L2s, zkSync Era prioritizes inheriting the full security guarantees of Ethereum, […]
ZKFair is not just another ZK-Rollup; it positions itself as the first community ZK-L2 based on Polygon CDK and Celestia DA, with a commitment to 100% fairness and decentralization. In a space often dominated by venture capital and pre-mined tokens, ZKFair aims to be different, ensuring that its users are not just participants but also […]
Zilliqa (ZIL) is a high-performance Layer 1 blockchain utilizing sharding for scalability. It supports smart contracts, NFTs, and decentralized applications. Their vision was to create a high-throughput, secure, and developer-friendly blockchain platform capable of supporting a vast array of decentralized applications (dApps), from gaming and metaverse experiences to decentralized finance (DeFi) and real-world asset tokenization. […]
ZetaChain (ZETA) is a Layer 1 blockchain enabling omnichain smart contracts across Bitcoin, Ethereum, and Solana, facilitating seamless cross-chain interoperability. ZetaChain aims to be the foundational, public blockchain that enables omnidirectional interoperability – meaning it can connect to, read, and write to any blockchain, whether it supports smart contracts or not. It’s designed to be […]
Get breaking crypto news and market alerts delivered straight to your phone.