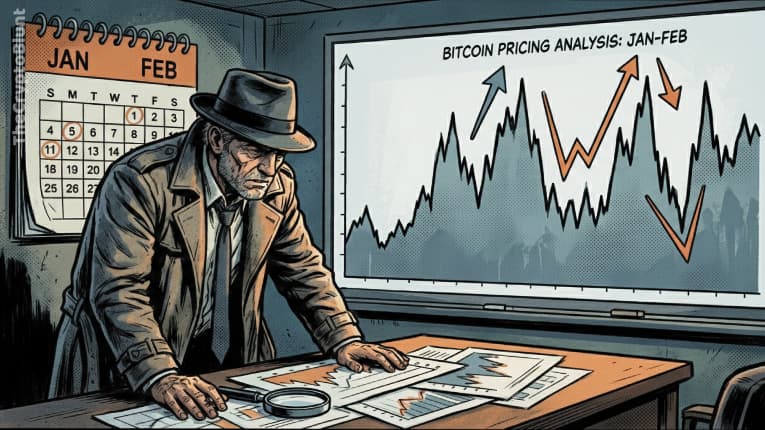
Bitcoin’s price action through January and February has reflected a classic mid-cycle tug-of-war between bullish structural demand and short-term liquidity pressure. While the broader trend remains constructive on higher timeframes, recent volatility highlights how sensitive the market is to macro flows, derivatives positioning, and technical levels.
Below is a deep technical breakdown of Bitcoin’s performance during the January–February window and the key forces driving the up-and-down moves.
January: Momentum Extension Meets Profit-Taking#
January began with strong bullish carryover as Bitcoin extended its prior uptrend. Institutional narratives and positive sentiment initially supported higher prices, but technical exhaustion soon emerged.
Traders closely watched momentum indicators during this phase because historically, January often sets the tone for Q1 crypto performance.
Bitcoin entered January with strong residual momentum from the prior quarter. Early price action showed:
- Higher highs and higher lows on the daily timeframe
- Strong spot ETF inflow narrative supporting demand
- Positive funding rates across major derivatives venues
However, by mid-January, the rally began to stall.
What changed technically?#
1. Overextended RSI
The daily Relative Strength Index moved into overbought territory (>70), historically a zone where Bitcoin often pauses or retraces.
2. Rising Exchange Inflows
On-chain trackers noted an uptick in BTC moving toward exchanges — typically a precursor to profit-taking pressure.
3. Resistance Cluster Formation
This combination triggered the first meaningful pullback of the year.
Overall, January’s action suggested healthy cooling rather than structural weakness, keeping the broader bullish thesis intact.
Late January: Controlled Correction Phase#
The late-January decline unfolded in an orderly manner, lacking the panic typically seen in major trend reversals. Market structure remained relatively stable despite the pullback.
This phase is important because controlled corrections often separate strong bull markets from fragile rallies.
The late-January decline was notable for what it did not show — panic.
Instead of capitulation:
- Volume remained moderate
- Long-term holder supply stayed relatively stable
- The 200-day moving average remained far below price
This suggests the move was primarily leveraged long unwinding, not structural selling.
Derivatives data signals#
Market analytics during this period showed:
- Falling open interest
- Cooling funding rates
- Reduced perpetual futures premiums
This pattern typically indicates healthy deleveraging rather than trend reversal.

Importantly, this type of reset often builds a stronger foundation for the next directional move.
February: Volatility Compression and Range Behavior#
February trading has shifted into a more indecisive phase, with price action becoming increasingly range-bound. Momentum has cooled as both buyers and sellers hesitate near key levels.
Periods like this often precede major breakouts, making the current structure especially important for traders.
February has so far been characterized by choppy, range-bound trading.
Key technical features#
Range Formation
Bitcoin has been oscillating between well-defined support and resistance zones, creating a textbook consolidation box.
Volatility Compression
Bollinger Bands on the daily timeframe have narrowed — often a precursor to a larger directional move.
Mixed Momentum Signals#
- MACD flattened
- RSI hovered near neutral (~50)
- Volume declined on rallies
This reflects market indecision rather than strong bearish conviction.
Historically, prolonged compression phases tend to resolve with sharp expansion in volatility.
Stay in the loop
Get crypto news before the market moves
Join thousands of investors who read our daily briefing.
No spam. Unsubscribe anytime.
Macro and News Drivers#
Beyond technicals, macro forces and narrative shifts have played a growing role in Bitcoin’s January–February behavior. Crypto markets remain tightly linked to global liquidity expectations.
Understanding these external drivers is essential for interpreting short-term price swings.
Several external factors have contributed to the uneven price action:
1. Liquidity Expectations#
Global liquidity expectations have fluctuated, and Bitcoin remains highly sensitive to:
- Real yield movements
- Dollar strength
- Risk-asset correlations
When liquidity expectations tighten, crypto tends to soften.
2. ETF Flow Dynamics#
Institutional spot flows remain one of the most important structural supports. However:
- Net inflows have become more inconsistent
- Momentum traders react quickly to flow slowdowns
- Short-term sentiment swings amplify price moves
This creates a “two-speed market” — strong long-term demand but fragile short-term momentum.
3. Derivatives Positioning#
Perhaps the biggest hidden driver has been positioning.
Throughout January–February:
- Leverage built up quickly during rallies
- Liquidations accelerated during pullbacks
- Funding repeatedly reset toward neutral
This reflexive cycle has kept Bitcoin trapped in volatile but contained ranges.
In modern crypto markets, derivatives flows frequently dominate short-term price direction.
Key Levels Traders Are Watching#
Technical traders are now focused on a tight cluster of support and resistance zones. These levels are likely to determine Bitcoin’s next multi-week move.
A confirmed breakout or breakdown from the current range could quickly accelerate volatility.
From a technical standpoint, several zones matter most:
Support Zones#
- Range low support (recent consolidation floor)
- 100-day moving average
- Realized price cluster
Resistance Zones#
- Range high rejection band
- Prior January distribution zone
- Psychological round-number resistance
Until one of these zones breaks decisively, range-bound conditions are likely to persist.
Bull vs Bear Scenarios#
Market participants are now weighing two primary paths for Bitcoin. Both scenarios remain technically plausible given the current neutral momentum.
The next few weeks of price action will be critical in determining which side gains control.
Bullish Case#
Bitcoin could resume its uptrend if:
- ETF inflows reaccelerate
- Price reclaims the range high with volume
- Open interest builds alongside spot demand (not just leverage)
In this scenario, the January pullback would look like a healthy mid-cycle reset.
Bearish Case#
Downside risk grows if:
- Support range breaks on high volume
- Long-term holders begin distributing
- Macro risk sentiment deteriorates sharply
That would shift the structure from consolidation toward deeper correction.
For now, the market remains balanced between these two outcomes.
Final Outlook#
Bitcoin’s January–February performance shows a market in controlled consolidation rather than structural weakness. The primary trend remains intact on higher timeframes, but short-term momentum has clearly cooled.
Right now, the market is waiting for a catalyst.
Until Bitcoin decisively breaks its current range, traders should expect:
- Continued volatility
- Fakeouts around key levels
- Sensitivity to macro headlines
- Derivatives-driven whipsaws
The next major move is likely building beneath the surface — but confirmation will come only when Bitcoin escapes its current consolidation range.